Sustainability
Environment
- Hisamitsu Pharmaceutical Group Environmental Policy
- Action to climate change
- Reduction in Environmental Impact
Action to climate change
At the Hisamitsu Pharmaceutical Group, all workers recognize the importance of environmental conservation and address social issues related to the environment. Assessing the environmental impact of the processes of R&D, production, and sales, we strive to reduce such impact in our value chain (e.g. modal shift in product transportation) and help realize a rich global environment. We would like to continue to proceed with our active efforts to prevent global warming by leveraging our products and business operations.
Contribution to Decarbonized Society
By participating in the “Federation of Pharmaceutical Manufacturers’ Associations of Japan: Low Carbon Society Action Plan” for the realization of a decarbonized society, the Hisamitsu Pharmaceutical Group reviewed its CO₂ emission reduction target in December 2021 and aims to reduce it by 46% compared to FY2013 by FY2030 (Scopes 1 and 2) and to achieve Carbon Neutrality by FY2050. In order to ensure consistency with the position of industry associations in our Climate Change Strategy, we participate in government-sponsored seminars on climate change, including those organized by the Ministry of Economy, Trade and Industry, the Ministry of the Environment, and the Ministry of Health, Labor and Welfare, as well as those organized by industry associations, to gather information and share it with our employees. Furthermore, the contents are checked to ensure that they are in line with the Company’s position and approach, and for any discrepancies, the environmental management division of the Company discusses them and then coordinate them through Sustainability Promotion Committee, which is chaired by the Sustainability Promotion officer. Through this process, the Company aligns its Climate Change Strategy with activities carried out by industry associations.
Disclosure in accordance with the TCFD
![]()
In May 2022, the Company endorsed the Task Force on Climate-related Financial Disclosure (TCFD), and based on its Recommendations, the Company conducted a scenario analysis of the items that climate change could bring to the business, identified risks (5 items) and opportunities (3 items), conducted a business impact assessment and disclosed the result thereof, and set goals and measures to assess the identified items in March 2023. Sustainability Promotion Committee took the lead in conducting scenario analysis, as well as in discussing short-, medium-, and long-term business impact (transition risk, physical risk, and financial impact of the opportunities), and policies and strategies for addressing these business impacts. As a result, although there are risks associated with the carbon tax and natural disasters, opportunities were identified in terms of increased demand for environmentally friendly products. So, we will give priority to taking measure for these risks and opportunities.
Governance
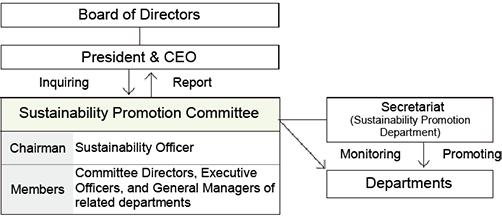
In recognizing environmental issues, including climate change, as important management issues, we have set “promoting environmental management” as an important materiality point.Basic policies and important matters related to climate change are deliberated by the Sustainability Promotion Committee, which promotes sustainability activities for the entire Group as an advisory body to the Representative Director.The Sustainability Promotion Committee mainly consists of Directors, Executive Officers, and General Managers of related departments, and it is chaired by a Sustainability Officer, who is responsible for climate change-related issues.
The Sustainability Promotion Committee meets quarterly, in principle, and by regularly reporting the content of its deliberations to the Board of Directors, it ensures that the Board of Directors appropriately supervises climate change initiatives and risk management.
Sustainability Promotion Structure
Strategy
Sustainability Promotion Committee took the lead in conducting scenario analysis of risks and opportunities related to climate change, as well as in discussing short-, medium-, and long-term business impact (transition risk, physical risk, and financial impact of the opportunities), and policies and strategies for addressing these business impacts. As a result, although there are risks associated with the carbon tax and natural disasters, opportunities were identified in terms of increased demand for environmentally friendly products.
Scenario analysis (Risks)
| Risk item | Importance Evaluation | Target | Measure | |
|---|---|---|---|---|
| Business Impact | Time Axis | |||
| Impact of theintroduction of a carbon tax | To reduce CO₂ emissions in Scope 1 and 2 by 46% by FY2030 compared to FY2013 and achieve net zero CO₂ emissions by FY2050, it is necessary to switch to renewable energy sources and renew air conditioning equipment, resulting in an increase in costs. | Long term | Improvement of reliance by stable energy procurement |
We will proceed to improve resilience by working with multiple businesses in different industries in order to achieve emissions by 46% from fiscal 2013 to fiscal 2030 for Scope 1&2 and the target of virtually zero emissions by fiscal 2050. |
| A carbon tax is imposed on the main raw materials (derived from petroleum), resulting in an increase in procurement costs. | Long term | Curbing procurement costs |
Strengthen supply chain management to control procurement costs. | |
| Impact on raw materials in association with a rise in temperature | Raw material prices rise due to restrictions on the amount of paper used, shortage of raw materials, and poor plant growth. | Long term | Establishment of supply chain that is unaffected by the price of raw materials | Stable procurement through cross-divisional communication with an eye to raw material procurement from the R&Dstage. |
| Natural disasters(Impact on the supply chain) | An increase in the number and severity of natural disasters causes damage to suppliers of raw materi als for our main products and disrupts the transpo rtation network. As a result, we are unable to manufacture our main products,leading to a decrease in sales. | Medium term | Promotion of stable procurement of raw materials | Promote stable procurem ent of raw materials by ensuring stock of raw materials and good engagement with suppliers. |
| Response to decarbonization technology | The lack of progress in environmentally friendly product development makes us unable to respond to changes in consumer needs.As a result,our market share declines with a decrease in sales. | Medium term | Promoting the development of eco-friendly products | Promoting the development and introduction of eco-friendly products |
※Definition of Time Axis; Short term: ~2025, Medium term:~2030, Long term:~2050
Scenario analysis (Opportunities)
| Opportunity Item | Importance Evaluation | Target | Measure | |
|---|---|---|---|---|
| Business Impact | Time Axis | |||
| Expansion of demand for environmentally friendly products | The development of new environmentally friendly products increases demand for our products, leading to an increase in sales. | Long term | Promoting the development of eco-friendly products | Promoting the development and introduction of eco-friendly products |
| Resilience | By switching from fossil fuels to renewable energy sources, we can avoid the impact of rising fossil fuel prices on costs. | Long term | Reducing cost against the increasing fossil fuel price. | Promoting the introduction of renewable energy |
| We can increase our resilience by working to develop energy-saving equipment in cooperation with production equipment manufacturers, thereby reducing energy costs. |
Long term | Improvement of effieciency for existing manufacturing facility. | Promoting the introduction of energy-saving equipment | |
※Definition of Time Axis; Short term: ~2025, Medium term:~2030, Long term:~2050
Risk Management
We recognize environmental issues, including climate change, as important management issues, and the Sustainability Promotion Committee examines them in more detail.Specifically, after identifying and evaluating risks and prioritizing them, each department that promotes environmental management incorporates climate change initiatives into action plans, and the Sustainability Promotion Committee monitors the action plans.The impact of identified climate-related issues is reported and proposed by the Sustainability Promotion Committee at a Board of Directors meeting, and the impact of climate-related issues is integrated into the company-wide risk management system.
Indicator and Targets
The Hisamitsu Pharmaceutical Group has identified "promoting environmental management" as part of materiality (one of the priority issues) and set "CO₂ emission reduction (Scopes 1 & 2)" as a KPI (key performance indicator) for mitigating risks associated with climate change. To help achieve the targets set by the Japanese government and those set under the Law Carbon Society Action Plan of the Federation of Pharmaceutical Manufacturers' Associations of Japan, in which the Group participates, we have set a mid-term target of reducing CO₂ emissions by 46% by FY2030 compared to FY2013, with an eye toward achieving net zero CO₂ emissions by FY2050.
| Indicator | Targets | Results (FY2023) |
|---|---|---|
| CO₂ emissions (Scopes 1 & 2) | FY2024: Reduce CO₂ emissions by 29.8% or more (compared to FY2013) FY2030: Reduce CO₂ emissions by 46% (compared to FY2013) FY2050: Achieve net zero CO₂ emissions |
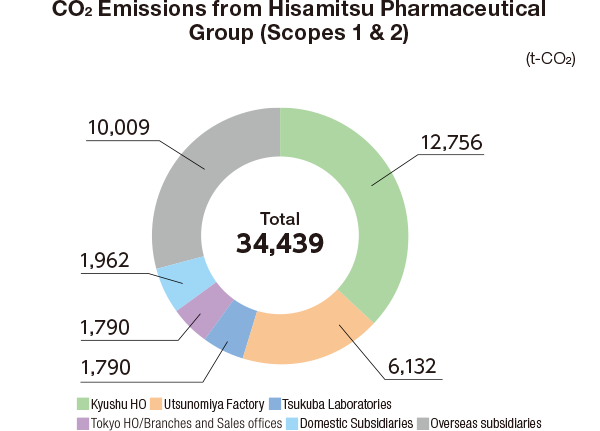
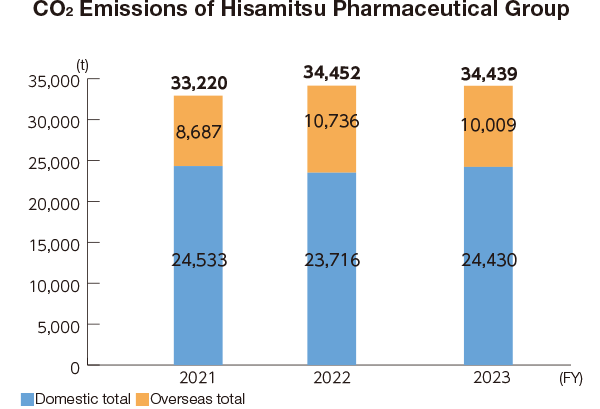
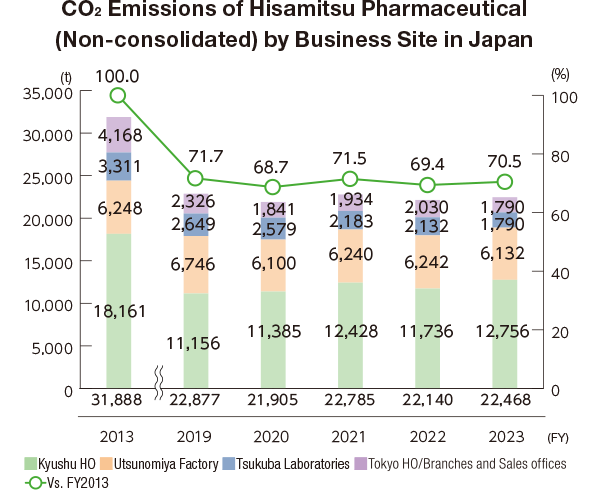
Hisamitsu Pharmaceutical Group: 34,439 t Reduced by 17.1% (compared to FY2013) Hisamitsu Non-consolidated: 22,468 t Reduced by 29.5% (compared to FY2013) |
Actions Related to Climate Change in FY2023
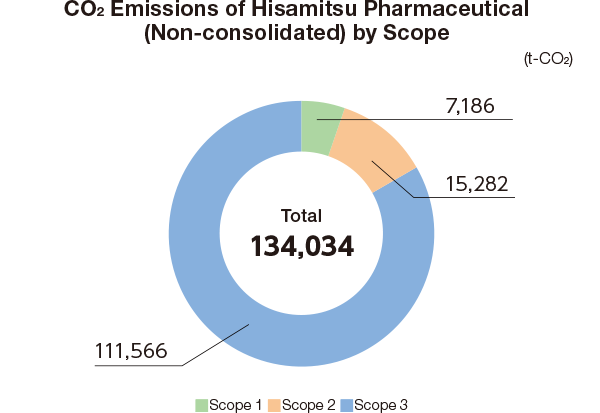
Social issues related to climate change is increasingly becoming important every year. Hisamitsu Group assesses the environmental impact of the processes of R&D, production and sales, and takes appropriate actions in all the areas of Scope 1, 2, and 3, including the reduction of such impact in our value chain to help realize a rich global environment.For Scopes 1 and 2 to be managed within our Group, we develop a specific plan from a mid-term perspective and introduce measures for it, as well as reviewing the progress every fiscal year and exploring new risks and opportunities to update the plan on an ongoing basis.For the production sites, we develop an investment plan based on a common management tool so that we can promote management as the Group and implement it after deliberation and approval of the Board of Directors.
Examples of specific activities in FY2023
In FY2023, we introduced renewed equipment in air conditioning, lighting and thermal systems.At the Utsunomiya Factory, a centrifugal chiller, which uses electricity, and an absorption chiller, which uses steam, are installed as a heat source for chilled water production. Generally, the centrifugal chiller is mainly used, but it is switched to the steam absorption chiller during times of day when the steam supply capacity is available, mainly in summer to reduce power usage.As for the installation of the NAS battery system at the Tosu Factory, it needed renewal. Examining the reduction of CO₂ emissions, we removed it. The removal led to reducing power usage without undermining the leveling of electrical energy use in connection with the current electricity supply system, resulting in reduction of power purchase by 889 Mwh, which is converted to CO₂ reduction of 361.8 t-CO₂.
Key Measures in FY2023
| Tosu Factory | Utsunomiya Factory | Noven | Hisamitsu Vietnam | Hisamitsu Brazil | |
|---|---|---|---|---|---|
| Air conditioning Equipment | ● | ● | |||
| Lighting | ● | ● | |||
| Heat Source | ● | ● | ● | ||
| Transportation Service | ● | ||||
| Operational Control | ● | ● | |||
| Other | ● | ● | ● |
CFC Management
Based on the “Act on Rational Use and Appropriate Management of Fluorocarbons” (abbreviated as “CFC Discharge Control Act”), we implement measures such as management of target equipment based on a ledger, simple inspection/periodic inspection, preparation of records, and calculation of leakage amount. At the time of equipment renewal, we are promoting the use of equipment using non-CFC and low global warming potential refrigerants. We will continue to implement measures to prevent leakage and global warming.
Reduction in Energy Use in Transportation
Although most of our products are transported by truck, we are working on a modal shift to reduce environmental impact on major routes with a high volume of transport, which will reduce the impact on the environment. In FY2023, we used ship and rail transportation, reducing CO₂ emissions by approximately 504 t compared to truck-only transportation. We will continue to strive to further reduce CO₂ emissions by actively incorporating ship and rail transportation while working to increase our loading efficiency and leveraging a joint delivery system.
Replacement with Hybrid Vehicles
We are working to reduce the environmental impact of corporate sales vehicles. For sales vehicles, we are gradually replacing our existing vehicles with hybrid models to reduce CO₂ emissions and conserve resources. As of February 2024, 98.8% of our sales vehicles are hybrid models. We plan to replace all of our vehicles with hybrid models by 2025. Moreover, at the Kyushu Head Office, two electric vehicles have been introduced since July 2022.
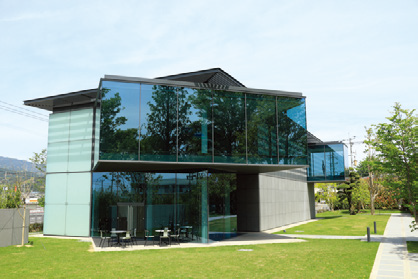
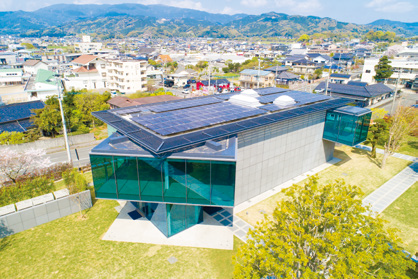
Hisamitsu Pharmaceutical Museum
Completed in February 2019 and certified as a ZEB (Zero Energy Building),* the Hisamitsu Pharmaceutical Museum (housed in the Kyushu Head Office) continued its energy-saving operation in FY2023 in accordance with the ZEB certification standards.
*Zero Energy Building (ZEB): Highest rank in the Building Energy-Efficiency Labeling System
Energy Consumtion at Overseas Factories
In FY2023, Hisamitsu Brazil and Hisamitsu Indonesia saw an increase in energy consumption due to increased production compared to FY2022. Since the usage of energy, such as electricity and fuel, increases or decreases according to the production volume, we will work to introduce energy-saving technology and further improve production efficiency in order to reduce energy consumption.
| FY2021 | FY2022 | FY2023 | ||
|---|---|---|---|---|
| Noven | Electricity (MWh) |
10,709 | 10,302 | 10,387 |
| Gas (㎥):LNG |
110,805 | 114,403 | 406,868 | |
| Light oil (KL) |
0.0 | 0.0 | 0.0 | |
| Hisamitsu Vietnam | Electricity (MWh) |
2,386 | 3,773 | 3,573 |
| Gas (㎥):LPG |
30,893 | 48,797 | 30,648 | |
| Light oil (KL) |
2.1 | 2.7 | 1.7 | |
| Hisamitsu Indonesia | Electricity (MWh) |
2,357 | 3,274 | 3,439 |
| Light oil (KL) |
112.0 | 256.0 | 312.0 | |
| Hisamitsu Brazil | Electricity (MWh) |
2,544 | 2,489 | 3,502 |
| Gas (㎥):LPG |
6,186 | 4,156 | 3,425 | |
| Light oil (KL) |
49.8 | 36.0 | 58.1 |
